
 How to use prepositions accurately in IELTS writing task 1 academic.
Updated: January 2024
It’s very important to get prepositions right when describing charts and statistics. I often see mistakes with prepositions when I mark task 1 reports and this is a particular issue when describing dynamic data.
Before you start writing you need to decide whether the task shows static or dynamic data in the graph or chart. Dynamic data indicates changes over time. When describing this kind of data you need to use trends language. This is where accurate use of prepositions will raise your grammar band score.
Grammar accounts for 25% of your marks in IELTS writing. If the data is reported inaccurately in academic task 1 you could also lose marks in task response.
Common prepositions and example sentences
at / between /on / in / by / from – to / of / over / during
A key point to consider here is whether the preposition is coming after the noun or the verb and also if a specific number or statistic is included. For instance, here are some sentences I recently saw in task 1 reports.
-
Noun – ‘ There was an increase in the population after 1998′
-
Noun – ‘ There was a population increase of 30% after 1998.
-
Verb – ‘ The population increased by 20,000 after 1998′
In the first sentence above there is no specific statistic, however, in the second sentence above you can see that the preposition is different as it is followed by a specific statistic. In sentence 3 after the verb ‘increased’ you need to use ‘by‘.
However, take a look at these 3 sentences below.
-
Verb – ‘ Sales of cars dropped from 30,000 units to 10,500 units over a 3 year period’
-
Noun – ‘ Car sales saw a decrease from 30,000 units to 10,500 units over a 3 year period’
-
Verb – ‘Car sales increased from 10,000 units to 23,000 units over a 3 year period’
In these examples, the preposition is the same after a verb or noun. To express either a downward or upward movement from one point to another, you can use from ….. to.
What does this look like in a Line graph?

1. The proportion of passengers dropped from 400 to just under 200.
2. The proportion of passengers dropped by just over 200.
3. There was a decrease in passengers from 400 to just under 200
As you can see, the start point is 400 and the end point is just under 200, so use ‘from -> to’. However, if you want to report on the amount of change between the two points use the preposition ‘by‘ as in sentence number2.
Sentence number 3 shows a noun ‘a decrease‘ so I can use the preposition ‘in‘ after that.
Using approximation
I also use the language of approximation here ‘just under / just over’ because in that part of the chart there is no exact number. In IELTS writing task 1 academic graphs you will need to use approximation if the line doesn’t show an exact number.
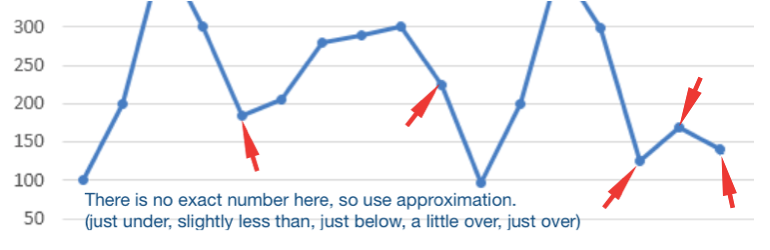
You can use ‘just over, just under, slightly more than / less than, a little over, a little under’ when describing graphs.
-
By 9 pm passenger numbers accounted for a little over 150.
-
At 10 pm the proportion of passengers stood at slightly less than 150.
-
By 6 pm the number of passengers stood at just under 400.
Be careful when using ‘by’ and ‘to’
Take a look at these examples of how to use ‘Decline by‘ and ‘Decline to‘ (it’s the same for a rising trend: increase to / Increase by) In the Line graph below to describe the change from April to May and May to June I can write:

From April to May the figure declined to 15%.
From May to June the figure increased to 30%
In this Line graph below to describe the change from April to May and June to July I now need to write:

From April to May the figure declined by 15%
From June to July the figure increased by a very small amount.
There is a big difference in the way these prepositions are used. Simple mistakes with by and to can cost you points in task 1.
Prepositions for date / time ranges
Let’s take a look at using in / over / during / between / at. When describing time periods or years or months you need to use ‘in‘ and ‘over‘. See the examples below taken from different types of IELTS task 1 reports.
‘In’ + months / years ‘over / during’ + a set time period
-
Car production increased by 20% in 2010
-
Sales of iPhones declined in January
-
Visitor numbers witnessed fluctuations over the 5 year period.
-
Coal exports declined considerably over the two decades.
-
Passenger numbers showed a slight increase during the whole period
‘Between’ / ‘and’ is used for a start and end time
-
Car production increased sharply between 2010 and 2012.
-
The proportion of visitors to the museum saw declines between January and November.
Using ‘begin at’ / ‘end at’ / ‘stood at’
-
The proportion of car exports stood at 30,000 in 2012.
-
Sales figures for electronics ended at just under 25% in the last quarter.
-
In 1990 the figure for nuclear energy used in France began at 50%.
Let’s practice
Take a look at the charts below, fill in the blanks then check your answers. Note that these are just sentences for practice purposes only, this is not a model answer.

Use these words below (some can be used more than once)
in / at / between – and / from / to / by / during / of
The monthly expenditure on children’s sports saw a rise ______ 20 pounds ____ a little over 30 pounds ______ 2008 ____ 2014.
Figures for participation in athletics started ___ around 1 million children ___ 2008. This remained constant until 2010. However, _______ 2010 _____ 2012 the proportion ____ children taking part in Athletics rose ____ 5 million with a slight dip ___ the end of the period.
The number ___ children taking part in swimming began ___ a little less than 2.5 million ___ 2008 and saw a steady increase ending ___ around 4 million.
The figure for youngsters participating in football stood ___ just over 7.5 million ___ 2008. ___2010 ___2014 it increased ___ approximately 1 million. All three sports showed increases ______ the whole period.
Useful Links
Click here for a lesson on trends language in IELTS academic writing task 1.
Click here for a lesson on useful vocabulary when describing data in writing task 1.
Click here for a lesson on how to paraphrase statistics in writing task 1
