IELTS academic writing task 1: C02 emissions line graph
Updated: May 2026
Line graphs are very common in IELTS academic task 1 writing. In this lesson, we will look at a Model Answer for CO2 emissions for 4 European countries and an analysis.
This line graph comes from Cambridge IELTS 11 academic. Use only official IELTS material when doing practice tests as there is a lot of fake IELTS material out there on the web.
Source: Cambridge IELTS 11 Academic.
See a lesson on the grammar used in this type of task click here
Model Answer
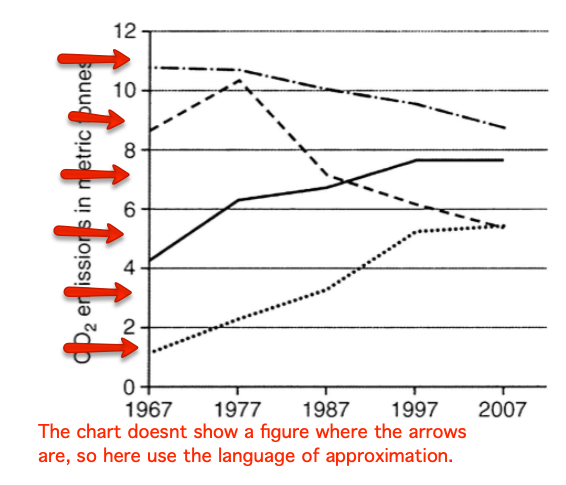
The graph illustrates the average output of carbon dioxide in metric tonnes for each individual in four European countries over a forty year period.
Overall, C02 output per individual in the UK and Sweden began the highest but witnessed a decline toward the end of the period. Conversely, Italy and Portugal began with relatively low emissions and indicated large increases by the end of the timeframe.
In 1967, the UK showed the highest proportion of carbon emissions at around 11 metric tonnes per person; however, this figure declined steadily ending at approximately 9 metric tonnes for each individual. Sweden’s output started at just over 8 metric tonnes, this then rose to a peak of approximately 11 tonnes in 1977 and then witnessed a sharp decline to approximately half of that by 2007.
In contrast, Portugal in 1967 had the lowest output at just over 1 tonne per person. Over the next four decades, this increased sharply ending at over 5 metric tonnes. Italy demonstrated a similar rising pattern, beginning at a little over 4 metric tonnes and levelling off at nearly 8 tonnes of carbon dioxide for each person by 2007.
187 words.
Word count
Keep your report at under 190 words. I have seen many task 1 reports with over 200 words which is far too long. Remember that you only have 20 minutes to write this. For task 1 academic it’s a good idea to aim for about 170 to 190 words to cover the task well. 150 words is considered the minimum but there is no penalty for going under this. However, you don’t get a higher band score for writing a very long report.
It is important to understand how the task is marked to give the examiner what they need for a higher band score.
Writing Task 1 is marked on 4 criteria:
Task Achievement (accurately write about the information presented)
Coherence and Cohesion (easy to understand, clear and logical)
Grammatical range and accuracy (using the correct grammar to describe the trends, numbers, comparisons)
Lexical Resource ( accurate clear vocabulary that is relevant to the task, good paraphrasing skills)
Grouping the information
You need to spend at least 3 minutes analysing the task and planning where to put the information. Grouping the information is crucial for a coherent logical response and a good band score in coherence cohesion.
The Introduction
I have paraphrased the task question here. You can use synonyms or you can change the grammatical structure of the sentences so that it retains the same meaning. Paraphrasing is not just about synonyms, you can re-arrange the sentences, this is a very important skill to practice.
The graph illustrates the average output of carbon dioxide in metric tonnes for each individual in four European countries over a forty-year period.
shows = illustrates
average carbon dioxide emissions = the average output of carbon dioxide
per person = for each individual
1967 and 2007= over a forty-year period
I didn’t paraphrase the word ‘graph’ because a graph is always a graph, you can’t really paraphrase this word. I also wrote ‘in four European countries’ instead of repeating the countries names.
The Overview
The overview is also an important feature in task 1 academic and your report must have one. The overview should not includeany numbers, statistics or dates. Leave those details for the body paragraphs. You will need to look at the main trends of the graph and write briefly about those. Pick out the main trends and give a summary.
Overall, C02 output per individual in the UK and Sweden began the highest but witnessed a decline toward the end of the period. Conversely, Italy and Portugal started with relatively low emissions but saw considerable increases by the end of the timeframe.
I start with the word ‘Overall’ this is a good way to introduce the overview. I have picked out the two main trends here which are:
The UK and Sweden = started high ended much lower.
Italy and Portugal = started low ended much higher.
Key vocabulary:
witnessed a decline
toward the end of the period
Conversely (shows contrast)
relatively low
saw considerable increases
by the end of the timeframe
Do not write a conclusion in writing task 1 academic. Never include an opinion, you must write factually.
Body Paragraphs
Now we can write in more detail about the graph and the trends. Also, remember to be selective and do not write about everything in the graph. Grouping the information is very important in this part of the task. Take the 2 main trends and separate them into 2 body paragraphs as below.
In 1967, the UK showed the highest proportion of carbon emissions at around 11 metric tonnes per person, however, this figure declined steadily ending at approximately 9 metric tonnes for each individual. Sweden’s output started at just over 8 metric tonnes, this then rose to a peak of approximately 11 tonnes in 1977 and then witnessed a sharp decline to approximately half of that by 2007.
In this body paragraph, I wrote about the 2 highest C02 outputs, which are the UK and Sweden and described how they declined in the 40 year period. I added more detail and numbers here, notice how I have used prepositions also (at, around, over, to, by) and most importantly you must use the language of approximation as there a no exact figures in the chart.
Key vocabulary:
the highest proportion of
declined steadily
rose to a peak
output = emissions
a sharp decline
each individual = per person
In the next paragraph, I have written about the 2 lowest C02 outputs (Italy and Portugal) and described how they increased in the 40-year time-frame.
In contrast, Portugal in 1967 had the lowest output at just over 1 tonne per person. Over the next four decades, this increased sharply ending at over 5 metric tonnes. Italy demonstrated a similar rising pattern, beginning at a little over 4 metric tonnes and levelling off at nearly 8 tonnes of carbon dioxide for each person by 2007.
Key vocabulary:
In contrast (shows contrast)
the lowest (superlative)
just over
increased sharply
ending at
demonstrated a similar rising pattern
beginning at …. levelling off at
Using the language of comparisons is useful in this kind of task, make sure you know how to use comparatives and superlatives, especially if you get a graph or bar chart with 2 or 3 trends.
Language of approximation
In the graph, there is no figure in between the lines so you will need to use approximation for a better band score in vocabulary. It is important to notice this as it is common in many IELTS graphs or charts.
around 11 metric tonnes.
just over 8 tonnes of C02 emissions.
just under 11 tonnes.
a little more than 4 metric tonnes of C02 output.
slightly higher than 4 metric tonnes.
slightly less than.
approximately 11 tonnes of CO2.
Close to 11 tonnes.
Almost 11 tonnes.
Using more academic vocabulary
For a higher score in vocabulary use more academic vocabulary when describing the data. such as: ‘proportion, figure, accounted for, amounted to, totalling, stood at, comprising’
Example sentences:
The proportion of C02 emissions stood at around 7 metric tonnes for Sweden in 1967.
The figure for C02 output for Portugal totalled nearly 6 metric tonnes in 2007.
The UK had the highest amount of emissions comprising nearly 11 metric tonnes in1967.
C02 output for Italy accounted for just over 4 metric tonnes in 1967.
To see lessons on the vocabulary to use in writing task 1 click on the links below:
9 thoughts on “IELTS writing task 1: Line graph and model answer”
The graph provides the amount of carbon dioxide which was emitted per person in the four European countries over a 40-year period, starting from 1967.
Overall, it can be seen that, average carbon dioxide emissions per person increased in Portugal and Italy, whereas it decreased in United Kingdom and Sweden. Further the emissions of carbon dioxide per person in Sweden were variation over the period shown.
Looking at the data sets that increased in more details, it is evident that the emissions of carbon dioxide per person in Portugal stood at about 1.7 metric tone (mt) in 1967. By 2007, it had climbed to 5.8 (mt). Which was the highest point on the chart. The amount of carbon dioxide which was emitted per person in Italy was 4.2 (mt) in 1967 and it rose which was almost 7.9 (mt). Carbon dioxide emissions per individual in Italy, therefore showed the greatest increase between two countries over the period shown.
Turning to the remaining data sets that decreased, it can be seen that carbon dioxide emissions per individual in United Kingdom was approximately 11 (mt) in 1967. This figure dropped to 8.7 (mt) in 2007. Similarly, the emissions of carbon dioxide per person in Sweden fell from 4.2 (mt) in 1967 to 5.8 (mt) in 2007.
The line graph gives data on how much CO2 an average person emitted in four countries from 1967 to 2007.
Overall, the amount of carbon dioxide emitted by people in the UK and Sweden saw a decline throughout the given period. On the contrary, it rose dramatically in Italy and Portugal.
The highest proportion of carbon dioxide emitted by one person belonged to the UK at the beginning of the period(1967),with nearly 11 metric tonnes, followed by Sweden, which started with slightly over 9 metric tonnes. The former country’s rate decreased persistently until 2007. Unlike the UK, Sweden saw a sharp increase in the first 10 years before dipping fast during the next decade. After 1987, the downward trend continued, reaching below 6 metric tonnes.
Italy showed the best continual trend, starting with more than 4 tonnes and reaching approximately 8 tonnes of CO2 emission per person during the years, with short-term fluctuations. As for Portugal, it was the least CO2-emitting country at the beginning of the period and continued increasing stably until 1997, then levelled off at 5 tonnes during the next decade at the same rate.
. (187 words)
In 1967, the average CO2 emissions in the UK and Sweden were nearly 11 and 9 metric tonnes respectively. Sweden’s emissions rose significantly from about 9 metric tonnes in 1967 to approximately 10.5 metric tonnes in 1977, then dropped suddenly to around 5.5 metric tonnes, surpassed by Italy 1990 while the United kingdom’s emissions were decreasing gradually until reaching 9 metric tones in 2007, becoming one the highest emitters of CO2.
In early 1967, the average carbon emissions in Italy and Portugal were around 4 and 1.5 metric tones, respectively. CO2 Emissions in Italy rose significantly from around 4 to approximately 8 metric tonnes at the end of the period, exceeding Sweden’s emission in 1990 at around 7 metric tonne. Meanwhile, in Portugal, the country’s emissions grew steadily from around 1.5 to above 5 metric tonnes in 1997, before climbing slowly in the following years, meeting Sweden at the same lowest position.
[I MIGHT TRY TO SEND ITNRO & OVERVIEW OF THIS GRAPH]
Hello, I am Karim Muratov from Uzbekistan. I tried to study for IELTS at home so can you check my intoduction and overall. Thank you.
The graph gives information about how many residents discharged CO2 in four countries from 1967 to 2007.
Overall, it is clear that the UK made up the largest proportion of CO2, while Portugal accounted for the least share. Moreover, it is also worth mentioning that the difference between the biggest and the smallest was significant.
Hi, it’s a good attempt but the sentence ‘…how many residents discharged’ is not accurate, it would be better to say ‘..carbon output for the inhabitants of four European countries’ .

 Source: Cambridge IELTS 11 Academic.

The graph provides the amount of carbon dioxide which was emitted per person in the four European countries over a 40-year period, starting from 1967.
Overall, it can be seen that, average carbon dioxide emissions per person increased in Portugal and Italy, whereas it decreased in United Kingdom and Sweden. Further the emissions of carbon dioxide per person in Sweden were variation over the period shown.
Looking at the data sets that increased in more details, it is evident that the emissions of carbon dioxide per person in Portugal stood at about 1.7 metric tone (mt) in 1967. By 2007, it had climbed to 5.8 (mt). Which was the highest point on the chart. The amount of carbon dioxide which was emitted per person in Italy was 4.2 (mt) in 1967 and it rose which was almost 7.9 (mt). Carbon dioxide emissions per individual in Italy, therefore showed the greatest increase between two countries over the period shown.
Turning to the remaining data sets that decreased, it can be seen that carbon dioxide emissions per individual in United Kingdom was approximately 11 (mt) in 1967. This figure dropped to 8.7 (mt) in 2007. Similarly, the emissions of carbon dioxide per person in Sweden fell from 4.2 (mt) in 1967 to 5.8 (mt) in 2007.
At 220 words it’s too long for a task 1 report.. aim for 160 to 190 words and make it more concise.
The line graph gives data on how much CO2 an average person emitted in four countries from 1967 to 2007.
Overall, the amount of carbon dioxide emitted by people in the UK and Sweden saw a decline throughout the given period. On the contrary, it rose dramatically in Italy and Portugal.
The highest proportion of carbon dioxide emitted by one person belonged to the UK at the beginning of the period(1967),with nearly 11 metric tonnes, followed by Sweden, which started with slightly over 9 metric tonnes. The former country’s rate decreased persistently until 2007. Unlike the UK, Sweden saw a sharp increase in the first 10 years before dipping fast during the next decade. After 1987, the downward trend continued, reaching below 6 metric tonnes.
Italy showed the best continual trend, starting with more than 4 tonnes and reaching approximately 8 tonnes of CO2 emission per person during the years, with short-term fluctuations. As for Portugal, it was the least CO2-emitting country at the beginning of the period and continued increasing stably until 1997, then levelled off at 5 tonnes during the next decade at the same rate.
. (187 words)
please assess my writing with ielts band score
For writing assessments, see the writing correction service on this website, we do not offer free corrections.
“Output” has a positive meaning. I wouldn’t use this word. Emission would be the best choice, right?
no, CO2 output is fine
THIS IS FROM MY MENTOR(HASAN.BD)[BODY1&2]
In 1967, the average CO2 emissions in the UK and Sweden were nearly 11 and 9 metric tonnes respectively. Sweden’s emissions rose significantly from about 9 metric tonnes in 1967 to approximately 10.5 metric tonnes in 1977, then dropped suddenly to around 5.5 metric tonnes, surpassed by Italy 1990 while the United kingdom’s emissions were decreasing gradually until reaching 9 metric tones in 2007, becoming one the highest emitters of CO2.
In early 1967, the average carbon emissions in Italy and Portugal were around 4 and 1.5 metric tones, respectively. CO2 Emissions in Italy rose significantly from around 4 to approximately 8 metric tonnes at the end of the period, exceeding Sweden’s emission in 1990 at around 7 metric tonne. Meanwhile, in Portugal, the country’s emissions grew steadily from around 1.5 to above 5 metric tonnes in 1997, before climbing slowly in the following years, meeting Sweden at the same lowest position.
[I MIGHT TRY TO SEND ITNRO & OVERVIEW OF THIS GRAPH]
Hello, I am Karim Muratov from Uzbekistan. I tried to study for IELTS at home so can you check my intoduction and overall. Thank you.
The graph gives information about how many residents discharged CO2 in four countries from 1967 to 2007.
Overall, it is clear that the UK made up the largest proportion of CO2, while Portugal accounted for the least share. Moreover, it is also worth mentioning that the difference between the biggest and the smallest was significant.
Hi, it’s a good attempt but the sentence ‘…how many residents discharged’ is not accurate, it would be better to say ‘..carbon output for the inhabitants of four European countries’ .
If you need corrections on writing take a look at the correction service at this link here: https://ieltsfocus.com/writing-correction-service/
Thanks