

IELTS pie charts in writing task 1.
Updated: April 2024
With IELTS pie charts you have to compare and contrast the information and pick out the key features of the graph or chart and write about those. Here is a detailed lesson about how to approach this kind of task. Take a look at an example task and the model answer.
Static data and dynamic data.
Static data means that the chart shows one period of time. Dynamic data shows two or more periods. It also shows how trends change over a period of time.
Different language will be used for static charts and dynamic charts. Always make sure that you first analyse the chart or graph to see if it is one time period, or if the data is changing over time. If you use trend language for a static chart you will lose marks for grammar.
In this lesson, I will look at.
1. The structure for IELTS writing task 1
2. Paraphrasing the introduction
3. Writing the overview
4. Body paragraphs
5. Example pie chart and model answer.
You should spend about 20 minutes on this task
The pie charts below show the percentage of electricity production by fuel source in France in 1990 and 2010
Summarise the information by selecting and reporting the main features and make comparisons where relevant.
Write at least 150 words

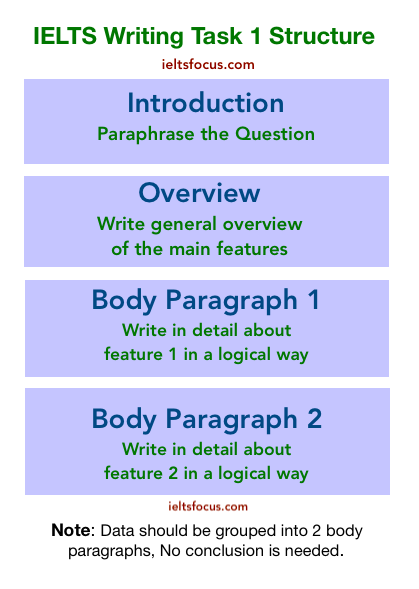
1. Structure
IELTS writing task 1 academic has the same structure for all the tasks. This is different for Writing task 2 which has various essay structures. You must only write facts and compare data in task 1, no opinion is given and no conclusion is needed. Have a look at the structure below. Remember to compare and contrast when writing about pie charts and pick out the key features of the charts.
2. The Introduction.
Here we must paraphrase the task and add key information, for example:
“The pie charts below show the percentage of electricity production by fuel source in France in 1990 and 2010”
I can change the wording below to:
The pie charts compare the amount of electricity created from five different sources of fuel in France in 1990 and 2010. These were oil, coal, natural gas, hydropower and nuclear power
The red words are paraphrased and I have added the 5 types of sources of fuel. I cannot change the words ‘pie charts’ or ‘sources of fuel‘ or ‘France 1990, 2010’ this information stays the same and doesn’t get paraphrased.
3. The Overview
Here we take the key information and summarise it for example:
- nuclear power increased considerably.
- natural gas production declined sharply.
- oil and coal also saw declines.
- hydropower showed a slight decrease.
Overall, the use of nuclear power for generating electricity in France increased considerably, whereas the use of natural gas declined sharply over the two decades. In addition, oil, coal, and hydropower all saw declines.
In the overview I have not mentioned dates or percentages, the overview is just to introduce and summarise the main features of the pie charts. I will go into more detail in the body paragraphs. I have also used phrases like ‘whereas’ and ‘In addition’. For time phrases I used ‘over the two decades’.
4. Body Paragraphs
Now I will go into detail about the changes and comparisons in the two pie charts quoting percentages.
In 1990 nuclear power as a source of energy stood at 17% of electricity production in France. Natural gas and coal both represented 28%. Oil was not far behind, accounting for just over a fifth of energy production. However, hydropower indicated only a small proportion of energy generated in 1990 and 2010.
Looking at the data for 2010, oil and coal both followed the same pattern and saw sharp declines dropping to 13% as a source of fuel for electricity with natural gas also seeing considerably less use at 4%. Most strikingly, nuclear power became the most relied-on form of energy, comprising 67% of total electricity production in 2010.
Grouping data
It is a good idea in writing task 1 academic to logically organise the information, so you can write about pie chart 1 (1990) in main body one and pie chart 2(2010) in main body two.
In nearly all charts or graphs in task 1, there are 3 trends: up, down, remaining stable. It’s quite straightforward and doesn’t need to be complicated.
5. Model answer

Any comments? write them in the comment box below
Thank you. This is awesome
Thanks, glad it was helpful.