
 IELTS writing task 1 bar graph.
Updated: Jan 7th 2022
The key thing to remember about line graphs and bar charts is that you must write about the key features and general trends over a period of time (if it is dynamic data) Some tasks are static where you would not use the language of trends though so spend a minute analysing the task and take two or three minutes to plan the task. Do not go directly into writing without a plan.
It is not necessary to go into too much detail but at the same time, you must cover every part of the task. In this lesson we will look at:
1. The structure needed for IELTS writing task 1.
2. Paraphrasing the introduction.
3. Writing an overview
4. Writing body paragraphs.
5. Example task and model answer.
Static and Dynamic data
Static data means that the chart or graph displays one period of time. Dynamic data shows two or more periods of time. It also shows how trends change over a period of time.
Different language will be used for static charts and dynamic charts. Always make sure that you first analyse the chart or graph to see if it is one time period, or the data is changing over time. If you use trends language for a static chart you will lose marks for grammar.
Note: The task in this lesson is for example purposes only and not an official task from Cambridge.
You should spend about 20 minutes on this task.
The chart below shows the number of passengers who used public transport in somewhere town from 2012 to 2015.
Summarise the information by selecting and reporting the main features and make comparisons where relevant.
Write at least 150 words.

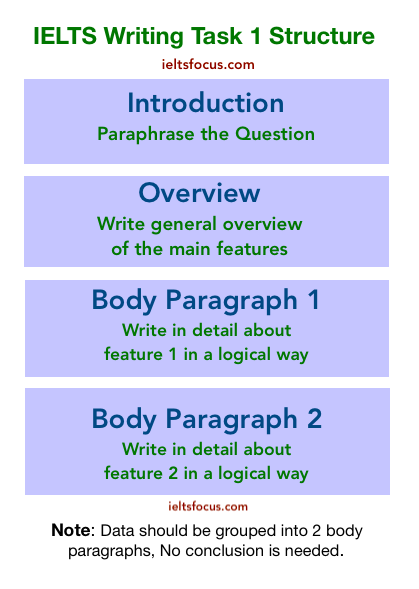
Structure
First of all, IELTS writing task 1 academic has the same structure for all the tasks. This is different for Writing task 2 which has various essay structures. One important point to remember is that we have to write facts and compare data in task 1, no opinion is given here and no conclusion is needed. Have a look at the structure below.
Remember to write about the main features of the graph and describe the trends over a period of time because it shows dynamic data.
The Introduction
Here you must paraphrase the task and add key information, for example:
‘The chart below shows the number of passengers who used public transport in somewhere town from 2012 to 2015.’
I can change the wording below to:
‘The chart indicates the number of people in thousands who took three types of public transportation, which were tram, bus and train in somewhere town in four years from 2012 to 2015.’
The red words are paraphrased and I have added key information from the chart. As you can see, I have kept the words chart and the somewhere town because this information cannot be changed. I added the types of transport mentioned in the chart and the number of people in thousands.
Overview
In this part, you must cover the key information and put it together to compare and summarise briefly what the chart is about. Do not include numbers, percentages or statistics here or go into too much detail. It is a general overview of the trends in this case. You will get a better band score if you can successfully write a good overview.
The key features from the chart are below.
The number of passengers using trams grew steadily.
The number of passengers using trains declined sharply.
The number of passengers using buses fluctuated.
‘Overall, the number of passengers using trams grew steadily and became the most popular form of transport. However, train passenger figures declined sharply but recovered by the end of the period while bus usage fluctuated throughout the timeframe’
In this overview, I have outlined the key features without going into too much detail. Also, I used words like grew steadily, declined sharply, fluctuated ..this vocabulary is necessary when describing changes and trends.
See here for a blog post on grammar for describing trends. In the overview, it’s useful to use comparatives and superlatives. The word ‘overall’ is also important to introduce the overview.
Body Paragraphs
Now I will need to write in more detail about the changes, data and numbers in the chart. Depending on the type of task given and the number of features, body paragraph 1 should be about similar trends whereas body paragraph 2 will be about different trends.
The number of passengers taking the train began at around 76,000 passengers in 2012. This figure then declined sharply in the following year to approximately 10,000 passengers. By 2015 train usage recovered to around 54,000 passengers. Bus passenger numbers followed a similar pattern starting at just over 50,000 passengers, declining in 2013, then recovering to the same figure as at the beginning of the period.
Conversely, about 23,000 people used trams in 2012 and over the next 3 years, the number of people taking this form of transport grew steadily to around 96,000 passengers in 2015. Trams proved to be the most popular form of transportation by the end of the timeframe.
Take a look at the body paragraphs again, you will see I have used words such as: approximately, about, around, just over. If you need to make an approximation you can use these phrases. In the graph you will notice that the numbers are not exact, so we have to give an approximate amount here.
I have highlighted in green the language of trends, as this is dynamic data showing different periods of time. Remember that no conclusion is needed in writing task 1 academic.
Model answer
Finally, here again, is the task and my model answer.

Any comments? please write them below.