
 Model answer: IELTS table about the production of grain.
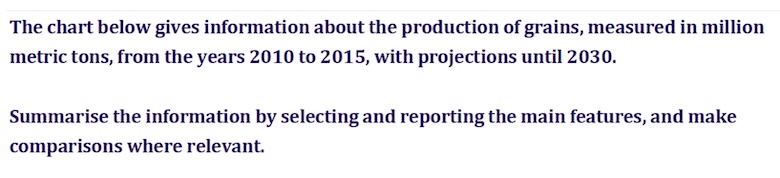
In this task we have a table with a past and future trend. It’s similar to a line graph as it’s dynamic data. Before you start writing you must always study the task and plan your essay, or task 1 report. This should take a few minutes only for a task 1 report and around 10 minutes of planning for a task 2 essay.
After the model answer below you will see that I have highlighted the vocabulary and grammar that is needed in this task such as trends language, future forms, and vocabulary for reporting on statistics.
Model Answer
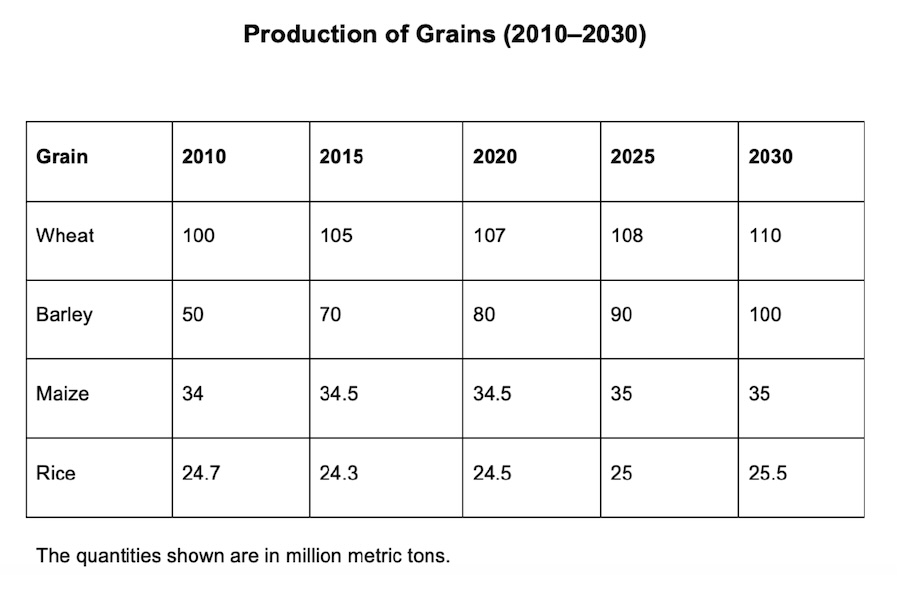
The table illustrates data regarding grain production in millions of tonnes from 2010 with forecasts to 2030. Overall, wheat and barley showed the highest yields and are likely to continue increasing, whereas maize and rice indicated lower yields and are set to remain largely unchanged.
Wheat production comprised the highest figure in 2010 at 100 million metric tonnes, rising to 105 million in 2015 with a slight increase to 108 million in 2025. Wheat production is forecast to increase to 110 million tonnes by 2030. Moreover, barley stood at 50 million in 2010 and saw a consistent rise to account for 90 million in 2025, and this is anticipated to rise to 100 million tonnes by 2030.
In contrast, maize and rice saw lower yields, with maize amounting to 34 million tonnes in 2010, it showed only a marginal increase of 0.5 million in 2015 and 2020. It is expected to remain at 35 million by 2030. Rice showed the lowest production, accounting for 24.7 million tonnes in 2010, it witnessed a dip in 2015, and rose again to 25 million in 2025. Rice is predicted to increase marginally by 0.5 million tonnes by 2030.
194 words
Green = future forms
Blue = vocabulary for reporting on data
Purple = trends language
Any questions? leave a comment.